QA-QC Protocols and Spectra
Introduction
This page contains spectra that are representative of the normal level of performance of this instrument. A brief description of the acquisition protocol is given for each set of measurements. More detailed information about the proper instrument set-up and operational parameters necessary to reproduce these measurements can be found in the appropriate training manual or application note.
NMR Specification Tests
Typically, the two parameters of concern in NMR are resolution/lineshape and sensitivity. This page contains information regarding the specifications for the DRX 400. It also contains a recent set of lineshape and sensitivity spectra for 1H and 13C for reference. Additional nuclei can be tested upon request. We ask that any time you have a question about lineshape or sensitivity, you first run one of the test protocols listed below in order to ensure that the issue is not related to your sample. Once the issue has been identified, additional troubleshooting of sensitivity and/or lineshape can proceed. Because of the age of the DRX 400 and its lack of 3D gradient autoshimming, the baseline is not as well shimmed on some of our newer instruments. The spectrum contained below is a normal/acceptable level of performance.
Resolution/Lineshape Test Protocol:
- Insert the 3% CHCl3 in acetone-d6 sample. For measuring 13C lineshape, use the 40% Dioxane in Benzene-D6 sample.
- Perform LOCK, and shim Z, Z2, X and Y as directed in the DRX 400 User Guide.
- Load a standard proton experiment as directed in the user guide. Change ns=1, td=80k (80*1024). Type aq<enter> and a pop-up box should return aq=6.24. This parameter change is to ensure adequate acquisition time (aq) in order to eliminate truncation and obtain the full resolution of the peak. Also type si<enter> and make sure si=80k.
- Type rga<enter> and wait for it to finish, and then type zg<enter> to start the acquisition.
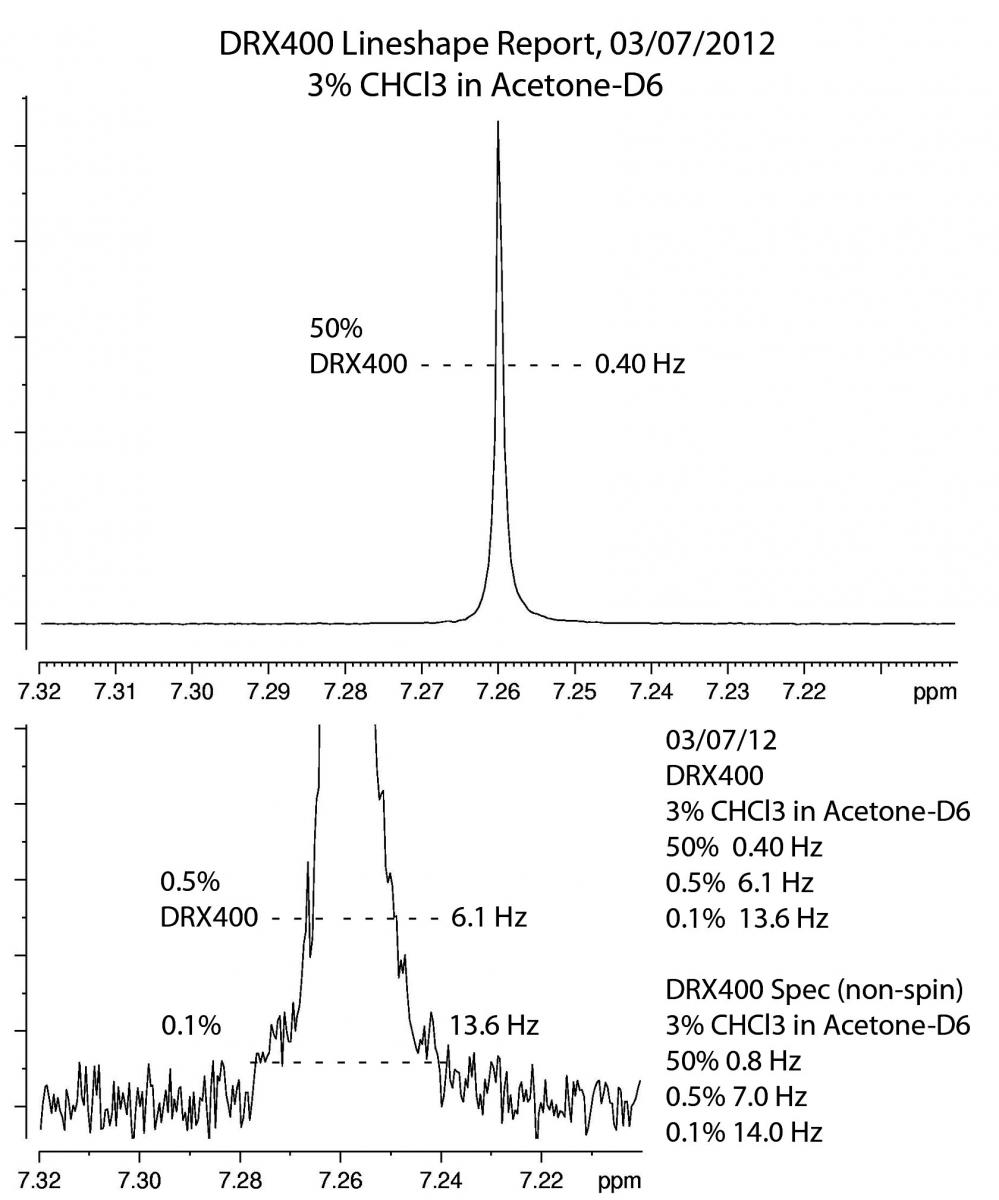
- When the experiment has finished acuiring, zoom in a region surrounding the chloroform peak and type humpcal<enter>. A window containing the linewidth values for 50%/0.5%/0.1% will pop up on the screen.
- If the lineshape is significantly broader than spec (e.g. 50% > 1.0 Hz), continue optimizing the shims, possibly optimizing Z3, Z4 and other higher order shims and re-acquire the spectrum (simply typing zg<enter> again will overwrite the previous data).
- If you can't get the lineshape to a reasonable value, send us an email containing the results of the lineshape test and we will re-shim the probe as soon as we are able. If the lineshape test meets spec but your particular sample has very broad lines, it is possible that something is wrong with your sample, the instrument cannot shim your sample well, etc.
Typical DRX 400 Lineshape: 50%/0.5%/0.1% = 0.5 Hz/15 Hz/30 Hz